
Ookla Analyst Report
Mobile Network Performance Across UK Local Authorities
Using Speedtest Intelligence® data, this report benchmarks mobile connectivity across local authorities in England, Scotland, Wales and Northern Ireland. It highlights the biggest movers over the past year and identifies the areas left behind as mobile not-spots.
Tracking the Mobile Progress of UK Local Authorities: 2025
Mobile connectivity across the UK is becoming faster and more responsive on average. Yet the urban-rural digital divide persists, and the gap between the best and worst-performing local authorities remains significant. Many Britons in rural areas remain connected to 5G networks for only a fraction of their time online, often at levels well below those seen elsewhere in Europe.
Ookla Speedtest Intelligence® data found that the number of local authorities where at least 60% of Speedtest samples met or exceeded a 25 Mbps “good experience” threshold grew from 112 in Q1–Q3 2024 to 126 in Q1–Q3 2025. In practical terms, the share of studied local authorities where a clear majority of tests achieve this performance level has risen from roughly two in three (about 64%) to just over seven in ten (around 72%) in a single year.
We are also including Speedtest data on mobile performance at both country and nation level to place local authority outcomes in their broader regional context.
Key Takeaways
- UK-wide median mobile download speed rose 15% year-on-year to 63.03 Mbps in 2025. Upload speeds improved from 7.80 to 8.21 Mbps; latency fell 4% to 50 ms. England and Northern Ireland saw the strongest gains. Wales remains the slowest nation, while Scotland’s median slipped from 49.13 to 46.05 Mbps despite improvements in several local authorities.
- The gap between local authorities remains stark. In Q1–Q3 2025, median speeds ranged from just over 10 Mbps (Shetland Islands) to just over 100 Mbps (Leicester). Around 28% of local authorities had fewer than 60% of Speedtest samples meeting the 25 Mbps download threshold, indicating persistently poor connectivity for many in the UK.
- Top performers include Leicester, Nottingham, Derby, Bridge of Don, Thurrock and Stoke-on-Trent. These areas typically combine median download speeds in the mid-80s to 100 Mbps, roughly three-quarters or more of samples reaching 25 Mbps, and relatively strong results even in the slowest 10th percentile (generally around 8–11 Mbps).
- Weakest performers include the Shetland Islands, Isle of Anglesey, Fermanagh and Omagh, Denbighshire, Pembrokeshire, Orkney and Cornwall. These areas have median download speeds mostly in the mid-teens to low-20s (with Shetland Islands closer to 10 Mbps), fewer than half of samples reaching 25 Mbps and 10th-percentile speeds typically in the 1.5–3 Mbps range, highlighting large not-spots for a significant share of users there.
- Population density correlates strongly with better outcomes. Practically, the findings herein illuminate the urban-rural digital divide, showing that where you live in the UK largely dictates your mobile experience. The strong correlation between download speeds and population density confirms that market forces prioritize infrastructure investment in dense, profitable urban centers, leaving rural communities with significantly poorer connectivity despite interventions like the Shared Rural Network (SRN) scheme.
Country and nation performance improve through 2025
At the country level, UK mobile performance improved notably between 2024 and 2025. The national median download speed rose from approximately 55.02 Mbps to 63.03 Mbps, representing a ~15% year-on-year increase. Median upload speeds also edged higher, from around 7.80 Mbps to 8.21 Mbps, while median latency improved marginally from 52 ms to 50 ms.
The UK ranks poorly, alongside European peers like Germany and Ireland
Speedtest Intelligence® | 2021 – 2025
In relative terms, this placed the UK 57th in the latest issue of the Speedtest Global Index for mobile performance, a decline in its ranking from the same period a year earlier due to faster improvements observed in other countries. It ranks alongside a small number of other advanced European economies that underperform on mobile performance, including Germany (56th) and Ireland (65th), and sits well behind frontrunners in Europe such as Bulgaria (5th), Denmark (11th) and the Netherlands (14th), all of which placed in the global top 15.
England maintains mobile lead among UK nations, Wales trails
Speedtest Intelligence® | Q3 2024 – Q3 2025
Mobile outcomes continue to improve unevenly across the UK’s nations. England remains the strongest performer, with median download speeds rising from 57.90 Mbps to 65.62 Mbps, uploads from 7.80 Mbps to 8.21 Mbps, and latency improving from 50 ms to 48 ms.
Northern Ireland showed strong progress from a lower baseline, with downloads climbing from 39.74 Mbps to 45.27 Mbps. However, it continues to suffer a material latency penalty from the physically longer routes that traffic must traverse before breaking out to the internet. This is reflected in median multi-server latency remaining stubbornly high at 66 ms, harming the experience in interactive applications like video conferencing and gaming relative to other UK nations.
Northern Ireland continues to feature latency penalty from longer traffic routes
Speedtest Intelligence® | Q3 2024 – Q3 2025
Wales, meanwhile, improved modestly (downloads up from 38.08 Mbps to 40.60 Mbps) but remains the slowest nation, and by the widest margin in several years. Scotland presents a mixed picture, with national median download speed actually slipping from 49.13 Mbps to 46.05 Mbps despite latency gains, suggesting that while some local authorities improved, others stagnated enough to drag down the national figure.
Local authority outcomes feature significant variation
Analysis of local authority outcomes using millions of Speedtest samples reveals the stark extent of regional variation within and across nations in the UK. Despite the general upward shift in the overall local authority distribution over the last year across key mobile performance indicators, the range remains large and many rural local authority areas are still stuck with not-spots despite the progress of the SRN scheme. Areas that were strong performers in 2024 generally remain strong, and many of the weakest authorities in 2024 still sit near the bottom of the distribution in 2025.
In 2025, looking across all studied authorities (over 140 based on including only those with a stringent minimum sample size), median download speeds span from just over 10 Mbps in the weakest authorities to just under 100 Mbps in the strongest. Authorities at the upper end of the speed range are delivering speeds several times higher than those at the lower end, which translates into very different experiences for residents and businesses. The weakest authorities have 10th-percentile speeds of around 1.6 Mbps, implying that a significant minority of users experience mobile connections that struggle even with basic web browsing and video applications.
Among the best-served areas in 2025, Derby leads with a median download speed of 99.88 Mbps, just under 80% of tests exceeding 25 Mbps, and even the slowest 10% reaching around 10 Mbps. Stoke-on-Trent, West Midlands and Castlereagh follow closely, each posting median speeds of roughly 88–95 Mbps with around four in five connections above 25 Mbps. Rounding out the top tier are The City of Brighton and Hove, Reading, Aberdeen City, Belfast, South Gloucestershire and Middlesbrough, all with median speeds in the mid-80s Mbps and roughly three-quarters or more of tests clearing the 25 Mbps threshold.
By contrast, a cluster of authorities continue to face significant performance challenges. The Shetland Islands has a median download speed of 10.25 Mbps, with only about 23% of tests reaching 25 Mbps and the slowest 10% of results at roughly 1.6 Mbps, while the Isle of Anglesey has a median download speed of 16.24 Mbps, with just under 40% of tests reaching 25 Mbps and similarly low speeds for the slowest 10% of connections.
Pembrokeshire, Cornwall, Carmarthenshire, Denbighshire, Gwynedd and Herefordshire all show median speeds in the low-20s Mbps, with fewer than half of tests reaching 25 Mbps and very low speeds for the slowest 10%. Causeway Coast and Glens in Northern Ireland and Scottish Borders exhibit somewhat higher medians in the mid- to high-20s Mbps but still see only around half of tests crossing the 25 Mbps threshold and weak performance for the slowest 10% of connections.
Top-performing local authorities are pulling away from bottom-performing ones
Among the studied local authorities, the lower quartile of median speeds rose from around 30 Mbps in 2024 to about 34 Mbps in 2025, while the upper quartile climbed from roughly 53 Mbps to around 62 Mbps. This suggests improvements have been broad-based rather than confined to the fastest authorities. For the slowest connections, the 10th-percentile metric shows more modest gains, with the typical authority moving from about 5.3 Mbps to around 5.6 Mbps and the upper end of the distribution improving more than the lower end.
The share of samples above 25 Mbps has also improved modestly across the UK. For the typical authority, this share rose from around 63% in 2024 to roughly 65% in 2025, while the upper quartile moved from about 68% to around 72%. Among the weakest authorities (around the bottom 10% of the distribution), the share of tests above 25 Mbps increased from roughly 47% to about 51%, but the gap between leaders and laggards remains substantial.
Some authorities stand out as clear improvers. Luton in England saw median download speeds rise from about 51 Mbps in 2024 to roughly 74 Mbps in 2025, while performance for the slowest 10% of tests improved from around 3.7 Mbps to about 6.2 Mbps and the share of samples above 25 Mbps grew from roughly 64% to about 73%. Aberdeen City in Scotland recorded similar gains, with median speeds climbing from about 72 Mbps to nearly 88 Mbps, 10th-percentile speeds increasing from around 8.0 Mbps to almost 9.9 Mbps, and the share of tests above 25 Mbps rising from approximately 75% to around 79%.
UK Local Authority Area Ranking by Most Improved between Q1-Q3 2024 and Q1-Q3 2025
| Local Authority/Area | Percentage of Speedtest users achieving mobile speeds of at least 25 Mbps (2024) | Percentage of Speedtest users achieving mobile speeds of at least 25 Mbps (2025) | Year-on-Year Improvement |
|---|---|---|---|
| 1. Dungannon and South Tyrone | 48% | 64% | +16% |
| 2. Omagh | 47% | 63% | +16% |
| 3. Carrickfergus | 48% | 61% | +13% |
| 4. Armagh | 60% | 72% | +12% |
| 5. Mid And East Antrim | 44% | 56% | +12% |
| 6. The City of Brighton and Hove | 72% | 82% | +10% |
| 7. Strabane | 55% | 65% | +10% |
| 8. Craigavon | 56% | 66% | +10% |
| 9. Luton | 64% | 73% | +9% |
| 10. Mid Ulster | 37% | 46% | +9% |
| 11. Ards | 56% | 65% | +9% |
| 12. Central Bedfordshire | 61% | 70% | +9% |
| 13. Bedford | 64% | 73% | +9% |
| 14. Derry | 65% | 74% | +9% |
| 15. Lisburn | 64% | 73% | +9% |
In Scotland, Dundee City saw median speeds rise from roughly 65 Mbps in 2024 to about 80 Mbps in 2025. The slowest 10% of speeds shifted from around 7.2 Mbps to more than 9.3 Mbps, and the share of tests above 25 Mbps grew from roughly 73% to about 76%. East Lothian in Scotland, starting from a much lower baseline, moved from median speeds of about 30 Mbps to around 38 Mbps, with the share above 25 Mbps rising from approximately 55% to just over 61%.
In Northern Ireland, Belfast improved from a median of roughly 82 Mbps to around 87 Mbps. Slowest-10% speeds rose from about 8.6 Mbps to more than 9.5 Mbps, and the share of tests above 25 Mbps increased from roughly 75% to about 78%. Derry also made progress, with median speeds moving from around 45 Mbps to roughly 54 Mbps, 10th-percentile performance improving from about 5.5 Mbps to around 8.7 Mbps, and the share above 25 Mbps rising from approximately 65% to around 74%.
At the other end of the spectrum, several authorities remain stubbornly weak. Isle of Anglesey, Pembrokeshire, Carmarthenshire, Denbighshire and Gwynedd in Wales, Cornwall and Herefordshire in England, Causeway Coast and Glens in Northern Ireland and Scottish Borders have improved only modestly from already low levels, with little change for the slowest connections.
Cornwall’s median download speed rose only slightly from around 21 Mbps to roughly 23 Mbps, slowest-10% speeds remain near 2 Mbps, and fewer than half of tests reach 25 Mbps. It underperforms other local authorities relative to what its population density would otherwise suggest. Anglesey, where median speeds remain stuck in the mid-teens, still records one of the lowest shares of tests above 25 Mbps (just under 40%) and some of the weakest 10th-percentile performance.
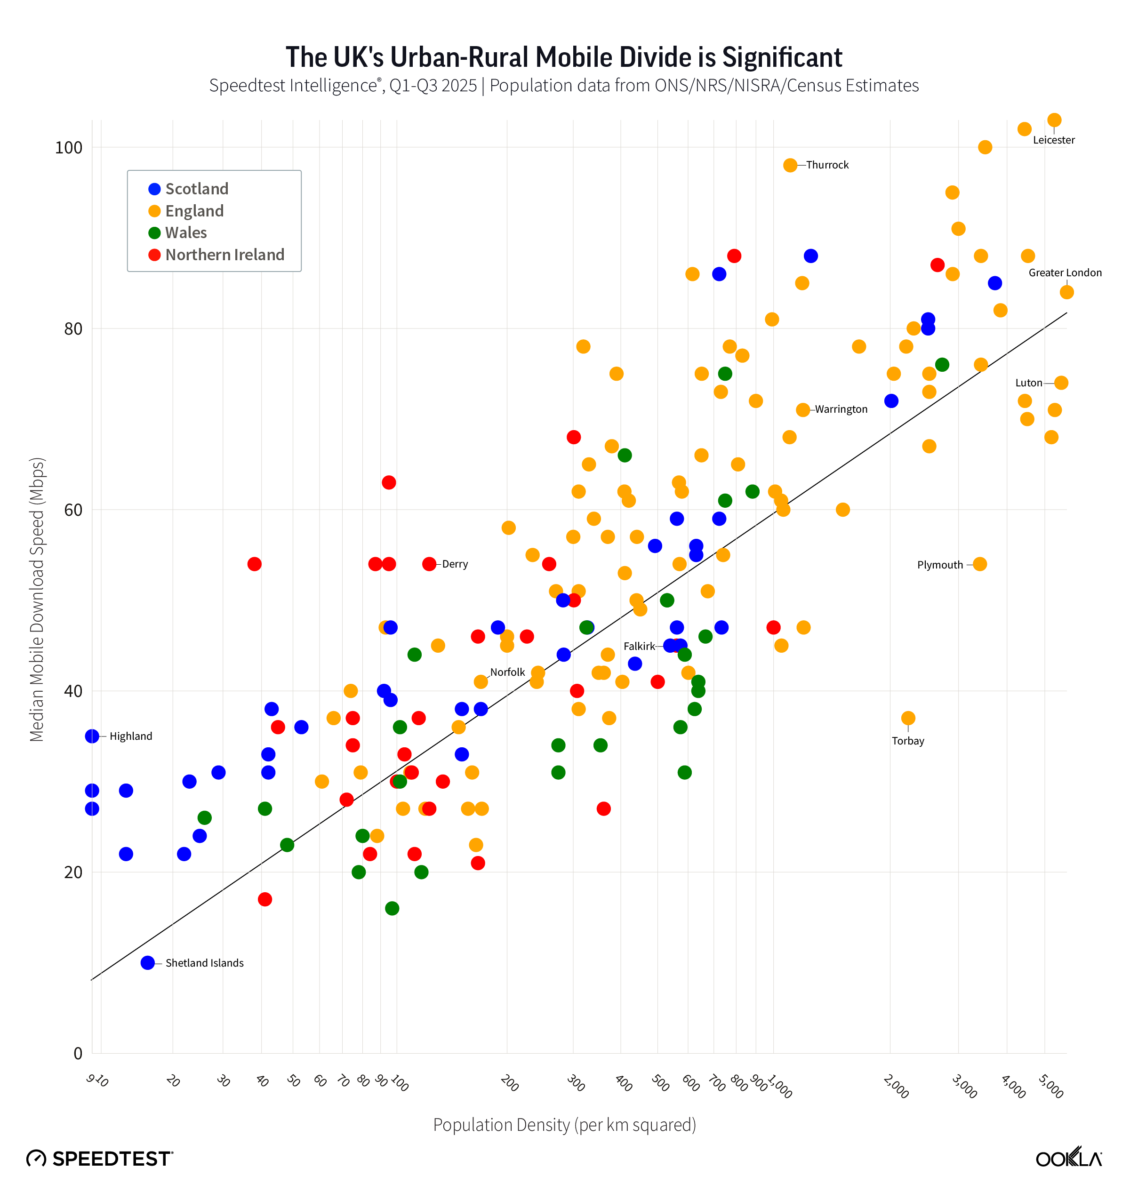
Urban-rural mobile divide shapes outcomes across local authorities
Mobile performance across the studied local authorities reveals a clear “density dividend” following a logarithmic trend: every tenfold increase in population density corresponds to roughly a 26 Mbps uplift in median download speeds. This relationship reflects more than a statistical pattern. It stems directly from network economics. Operators concentrate capital expenditure in densely populated areas, where the cost-per-passed premise is lower and high-capacity mid-band 5G spectrum delivers stronger returns on investment.
High-density urban authorities such as Leicester and Nottingham, with population densities exceeding 4,000 people per square kilometer, consistently deliver median speeds above 100 Mbps. In contrast, expansive rural areas like the Scottish Highlands and Powys, where density falls below 30 people per square kilometer, struggle to reach 30 Mbps. The result is that users in major metropolitan areas effectively experience a different tier of connectivity altogether.
This pattern is consistent with recent OECD work showing that, across OECD countries, users in metropolitan regions experience materially higher mobile performance than those in regions far from metropolitan areas. Using Speedtest data, the OECD estimated that the median mobile download speed gap between metropolitan regions and regions far from a metropolitan area expanded from 4.7 Mbps (Q4 2019) to 44.9 Mbps (Q4 2024), implying that upgrades tend to lift all boats, but not necessarily close absolute territorial gaps.
This persistent gap suggests that generational upgrades like 5G will not solve rural connectivity challenges on their own. Urban centers benefit from network densification and wide-bandwidth spectrum deployment, while rural areas remain reliant on low-band frequencies that prioritize coverage over capacity. Closing the divide will likely require structural changes to deployment models, whether through neutral host networks, government-backed infrastructure subsidies beyond the current SRN, or other approaches like direct-to-device satellite (for the last 1% outdoors).
Policy intervention and RAN investments drive progress
The positive overall trend observed in national outcomes reflects the cumulative impact of several supply-side interventions. The SRN, a £1 billion (US$1.3 billion) program jointly funded by the government and the four mobile network operators, has materially extended 4G geographic coverage into underserved areas. Mobile operators have invested over £500 million ($US 670 million) to deploy hundreds of new sites and upgrade thousands of others with additional spectrum and higher operating power. By November 2025, 99 government-funded mast upgrades had been activated across England, Scotland and Wales, and the program achieved 95% 4G geographic coverage from at least one operator a full year ahead of its 2027 target.
Analysis of Speedtest Intelligence data shows that the proportion of mobile users spending most of their time connected to 4G networks improved over the last year, with 4G Availability rising from 96% to 97% at the UK level. This expansion of the 4G footprint has driven increased voice over LTE (VoLTE) adoption, reducing reliance on the 3G-based circuit-switched fallback (CSFB) voice architecture and enabling operators to make further progress on the 3G sunset and refarm valuable low-band spectrum like 900 MHz for 4G.
The proportion of mobile users spending the majority of their time connected to 3G networks in the UK fell from 4.1% two years ago to 1.1% in 2025, with three of the four operators having fully completed their network sunset and the fourth (Virgin Media O2) expected to do so by the end of 2025. The 3G sunset has driven a marginal increase in time spent on 2G networks in the UK, more materially for some operators than others, as users fall back to the 2G layer where 3G has been removed and 4G/5G coverage may be still limited (e.g., in very rural areas or deep indoors).
More broadly, heavy capital spending on RAN and core transformation by operators is driving improved outcomes. Progress in the Huawei replacement program has removed a key constraint on network modernization, allowing operators to deploy current-generation equipment on new sites without the distraction of mandated infrastructure swaps. The UK remains one of only a handful of countries in Europe and globally where at least three operators have aggressively deployed 5G SA across a significant footprint (over 12,000 sites by July 2025 according to Ofcom), with one operator (VMO2) already reporting 70% population coverage and BT/EE touting a similar level.
VodafoneThree has committed to invest £11 billion (US $14.7 billion) in its UK network over the next decade, including £1.3 billion (US $1.7 billion) of capex in year one, under its merger undertakings. This funding will accelerate 5G SA rollout, targeting 99% 5G SA population coverage by 2030. VMO2, which invests roughly £2 billion (US $2.7 billion) a year in its networks and services, added a £700 million ($US 937.4 million) 2025 Mobile Transformation Plan and acquired 78.8 MHz of spectrum from VodafoneThree as a merger remedy, bringing its spectrum share to around 30%. The operator plans to deploy around 1,000 Nokia-powered “Giga Sites” capable of delivering more than 10 Gbps of 5G throughput.
Similarly, EE is deploying Ericsson’s Advanced RAN Coordination feature, an inter-site 5G downlink carrier aggregation technology that pools capacity across neighbouring cells, alongside new Massive MIMO radios and 1,500+ outdoor small cells. The operator has committed to extend 5G SA (5G+) coverage to 99% of the UK population by the end of 2030.
Data For Further Analysis Available Through Ookla for Good
UK local authorities that are seeing weaker mobile performance (or not-spots) may want to take a closer look at peers that are delivering stronger user experience, and consider what differences in network investment and local deployment conditions might be driving the gap.
Ookla for Good™ provides our full UK local authority mobile performance dataset used in this report to anyone who would like to run further analysis. It is designed to support work by public-sector, academic, and community-focused stakeholders that want to better understand real-world mobile experience across local areas and over time. To access the UK local authority dataset, download the file below:
Access the full local authority dataset used in this report
Ready for more? Submit the form and dive into detailed findings for all studied local authority areas in this report.
Methodological Overview
This report provides an overview of mobile network performance across the United Kingdom, focusing on outcomes at local authority level and on how those outcomes have changed over time. It is designed primarily for local government and municipal stakeholders who need to understand how mobile connectivity in their area compares with the rest of the UK and how that position is evolving over time.
The analysis is based on millions of Speedtest samples from mobile devices connected to cellular networks. It compares results from Q1–Q3 2025 with the same period in 2024, using a consistent methodology founded on a stringent minimum sample size to ensure statistical robustness in comparisons. For each local authority, the report considers not only typical speeds but also the experience of slower connections and the relationship between population density and mobile outcomes. At the UK and country (nation) level, it draws on national aggregate metrics (2025 to date) for the United Kingdom, England, Scotland, Wales and Northern Ireland.
To find out more about Speedtest Intelligence® data and insights, please contact us here.