United States
State of the Mobile Union Report
In the second half of 2025, RootMetrics conducted over 3 million tests to measure the real-world performance of the Big 3 mobile carriers in the United States. The following report provides a comprehensive picture of network performance at the U.S. national level, across all 50 states, and 125 of the nation’s largest metropolitan markets.
You’ll also find commentary from Ookla Analyst Mike Dano, who examines recent network developments and competitive dynamics in the U.S. in 2H 2025.

AT&T shares three national awards and shows improving speeds at both the national and metro levels
AT&T delivered strong national results in 2H 2025, sharing three U.S. RootScore Awards: Network Speed, Call Performance, and Text Performance. AT&T was a strong number-two performer in state testing, winning or sharing State Overall RootScore Awards in 29 states and earning 253 total state awards. In major cities, AT&T boosted its metro award tally from 592 in 1H 2025 to 648 in 2H 2025 and delivered median download speeds of at least 100 Mbps in 122 of 125 markets, up from 116 in 1H 2025.

T-Mobile ties with AT&T for the US Speed Award, boosts state and metro awards, and remains the 5G availability leader
T-Mobile continued to perform well in 2H 2025, maintaining the highest 5G availability at 95.2% and earning a share of the U.S. Network Speed RootScore Award. The carrier also increased its award totals across the country, boosting its state awards from 84 in 1H 2025 to 119 this time, while also increasing its metro award count from 535 to 588 in 2H 2025. In major cities, T-Mobile remained the only carrier to record median download speeds of at least 100 Mbps in all 125 markets and reached 200 Mbps in 124 of them.

Verizon overtakes AT&T to win national awards for overall performance and reliability, along with Best 5G Experience
Verizon delivered the strongest results in 2H 2025, earning seven U.S. RootScore Awards, including the Overall RootScore Award for best overall network performance and the Reliability RootScore Award, both of which AT&T had won in our previous report. The carrier also remained the clear 5G leader, winning Best 5G Experience, Fastest 5G, and Most Reliable 5G. Verizon topped both state and metro testing as well, earning 329 state awards and 801 metro awards—more than any other carrier—while improving its higher-end speeds, recording median download speeds of at least 200 Mbps in 104 cities, up from 92 in 1H 2025.
National RootScore Award Winners

-
Network Speed (Tie)
-
Call Performance (TIE)
-
Text Performance (tie)
-
Network Speed (TIE)

-
Overall Performance
-
Network Reliability
-
Network Responsiveness
-
Data Performance
-
Call Performance (Tie)
-
Text Performance (tie)
-
Video Performance
National Performance
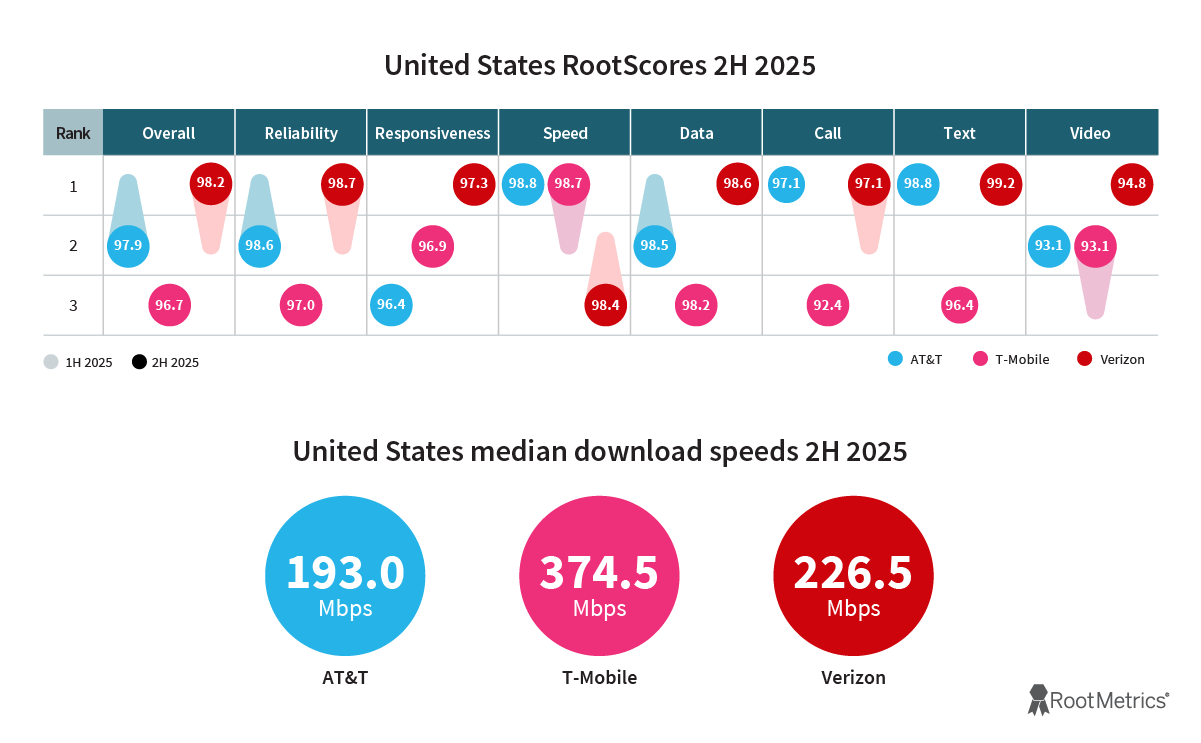
AT&T had a strong showing overall, with the carrier earning three awards (all ties) at the national level and finishing a strong second in four other categories. AT&T earned a share of three U.S. RootScore Awards, in the categories of Network Speed, Call Performance, and Text Performance. While AT&T’s rankings slipped from first to second in three categories (overall performance, reliability, and data performance), the carrier’s RootScores in those categories remained strong and close to those of Verizon. AT&T’s aggregate median download speed in national testing showed improvement, jumping from 168.7 Mbps in 1H 2025 to 193.0 Mbps this time. At speeds above 100 Mbps, AT&T users should be able to handle any typical mobile activity with ease.
T-Mobile earned a share of the Network Speed RootScore Award with AT&T. In previous reports, T-Mobile had generally placed third in the speed category, but in 2H 2025, T-Mobile boosted its speeds–especially its 5th percentile speeds–and improved from second place in the category in 1H 2025 to a two-way tie for first this time. T-Mobile also showed improvement in our Video Performance category, moving from third in 1H 2025 to second this time. Meanwhile, T-Mobile’s national median download speed of 374.5 Mbps was nearly identical to its speed in 1H 2025 (371.4 Mbps) and was faster than those of both AT&T and Verizon.
Verizon shined on the national stage in 2H 2025, improving its ranking in multiple categories and overtaking AT&T to win the Overall RootScore Award, which recognizes the nation’s best overall network performance, as well as the Network Reliability RootScore Award. Verizon earned seven US RootScore Awards, winning US RootScore Awards outright for overall performance, reliability, responsiveness, data, and video performance, while sharing awards for call and text performance. Verizon also showed a speed improvement, with its US aggregate median download speed climbing from 192.1 Mbps in 1H 2025 to 226.5 Mbps this time.

To learn more about RootMetrics testing, visit our methodology page. For more on mobile network performance across the United States, check out our US, State, and metro Area RootScore Reports.
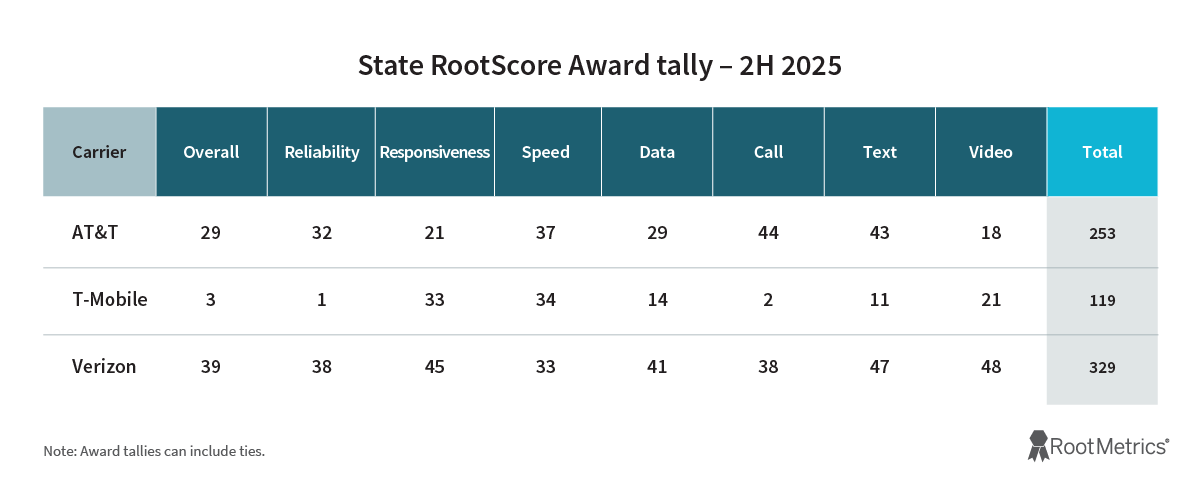
State Performance
AT&T was a strong number-two performer in state-level testing, winning or sharing 253 State RootScore Awards in 2H 2025. While that marked a decline from 288 State RootScore Awards in 1H 2025, AT&T delivered good overall results, winning or sharing State Overall RootScore Awards in 29 states, a number trailing only that of Verizon (39). AT&T took home over twice as many state awards as T-Mobile and won or shared at least 40 awards in the categories of call and text performance. Overall, AT&T posted strong results at the state level.
T-Mobile showed improvement in state testing in 2H 2025. While the carrier earned the fewest state-level awards, T-Mobile increased its award tally from 84 in 1H 2025 to 119 this time, a jump of 35 awards. T-Mobile’s most notable award gains came in the categories of responsiveness and speed. In the Network Responsiveness category, T-Mobile won or shared 33 awards, up from 22 last time, while the carrier boosted its number of Network Speed RootScore Awards from 29 in 1H 2025 to 34 in 2H 2025, a total trailing AT&T (37) but a tick ahead of Verizon (33).
Verizon was the top-performing carrier in state-level testing in 2H 2025, winning or sharing Overall RootScore Awards for the best overall network performance in 39 states—the most of any carrier—and earning a total of 329 State RootScore Awards, up from 271 in 1H 2025. Verizon also led all carriers for reliability at the state level, with Verizon winning or sharing 38 State Reliability RootScore Awards, compared to 1 for T-Mobile and 32 for AT&T. Verizon won or shared at least 40 state-level awards in four performance categories, including 45 for responsiveness, 41 for data performance, 47 for text performance, and 48 for video performance–the most of any carrier in all of those categories.
To learn more about RootMetrics testing, visit our methodology page. For more on mobile network performance across the United States, check out our US, State, and metro Area RootScore Reports.
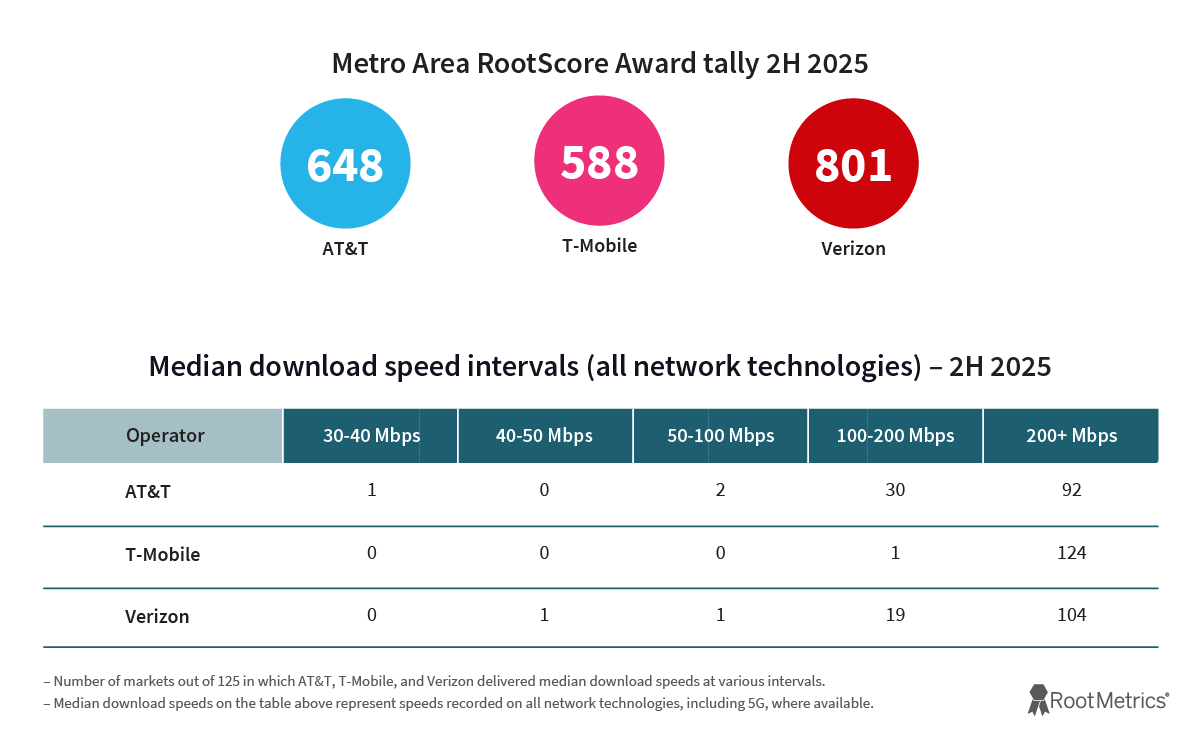
Metropolitan Market Performance
AT&T continued posting strong results in major cities. AT&T won or shared 648 Metro Area RootScore Awards in 2H 2025, an improvement from 592 last time and a tally higher than that of T-Mobile (588) but trailing that of Verizon (801). AT&T also delivered improved speeds in 2H 2025, increasing its number of markets with median download speeds of at least 100 Mbps from 116 in 1H 2025 to 122 out of 125 metros this time. AT&T also showed progress at the lower end of our speed intervals, as its number of markets with median download speeds below 100 Mbps improved from nine cities last time to only three in 2H 2025.
T-Mobile performed well in 2H 2025, winning or sharing 588 awards in major cities, an increase from 535 in 1H 2025. T-Mobile made notable improvements in the overall performance category, increasing its tally of Metro Overall RootScore Awards from 41 in 1H 2025 to 53 this time. Likewise, T-Mobile increased its tally of Reliability RootScore Awards from 32 in 1H 2025 to 46 in 2H 2025. The carrier also posted excellent speeds. T-Mobile remained the only network to record median download speeds of at least 100 Mbps in all 125 markets tested, and T-Mobile came close to hitting 200 Mbps in every one, reaching that mark in 124 cities. T-Mobile also stood out as the only carrier to record median download speeds above 600 Mbps, topping that mark in one market (Rochester, NY).
Verizon remained the leader in major cities in 2H 2025. The carrier won or shared 801 RootScore Awards, well ahead of the totals of either AT&T (648) or T-Mobile (588). Verizon’s award tally includes 97 Overall RootScore Awards out of 125 cities, ahead of AT&T’s 72 and T-Mobile’s 53. Verizon also continued to deliver strong speed results, taking home 99 Network Speed RootScore Awards—the highest total of any carrier—and delivering median download speeds of at least 100 Mbps in 123 markets, up from 122 in 1H 2025. Moreover, Verizon improved its higher-end speeds, clocking median download speeds of at least 200 Mbps in 104 cities in 2H 2025, up from 92 last time.
To learn more about RootMetrics testing, visit our methodology page. For more on mobile network performance across the United States, check out our US, State, and metro Area RootScore Reports.
3M+
Total tests conducted
6,800+
Indoor locations tested
246K+
Miles driven


-
Best 5G experience
-
Fastest 5G
-
Most Reliable 5G
-
Highest 5G Availability
Best 5G Experience
Verizon once again delivered the Best 5G Experience in 2H 2025. The carrier’s win in the category was led by strong reliability, fast speeds, and standout performances in both major cities and in rural areas. While Verizon’s 5G availability trailed that of other carriers, the carrier improved its 5G availability from 73.0% in 1H 2025 to 80.2% in 2H 2025. In short, Verizon delivered an excellent experience when users were connected to its 5G network. The carrier also earned top honors for 5G reliability and took home the Fastest 5G award as well, giving Verizon another excellent showing in 5G network testing.
To learn more about RootMetrics testing, visit our methodology page. For more on mobile network performance across the United States, check out our US, State, and metro Area RootScore Reports.
Fastest 5G
In a tight 5G speed race—where only one point separated the carriers’ scores—Verizon remained the 5G speed leader, winning the Fastest 5G award in 2H 2025. Verizon stood out for its strong speeds in rural areas and delivered the top 5th percentile 5G download speed in our national testing, reflecting the carrier’s excellent 5G speed consistency. Learn more about different speed metrics at our methodology page.
To learn more about RootMetrics testing, visit our methodology page. For more on mobile network performance across the United States, check out our US, State, and metro Area RootScore Reports.
Most Reliable 5G
Verizon remained the standard bearer for reliable 5G service in 2H 2025, earning its 10th consecutive Best 5G Reliability award with a leading score of 98.9. Verizon provided excellent 5G reliability in both urban and rural areas, helping set it apart from the other carriers.
To learn more about RootMetrics testing, visit our methodology page. For more on mobile network performance across the United States, check out our US, State, and metro Area RootScore Reports.
Highest 5G Availability
T-Mobile maintained its position as the leader for 5G availability in 2H 2025. The carrier recorded 5G availability of 95.2%, up from 93.8% in 1H 2025 and ahead of both AT&T (86.7%) and Verizon (80.2%). While T-Mobile’s 5G availability has been impressive in major cities for several years, the carrier’s lead in the category has held steady at the national level, even as our 5G testing has expanded to include both urban and rural areas as of 2024.
To learn more about RootMetrics testing, visit our methodology page. For more on mobile network performance across the United States, check out our US, State, and metro Area RootScore Reports.
Analyst Deep Dive
Overall, network performance gaps among the nation’s three big mobile network operators continue to narrow. That’s certainly what RootMetrics technicians found in the second half of 2025 as they drove 246,000 miles all over the U.S., testing cellular networks everywhere they went.
This narrowing is not a surprise. AT&T, T-Mobile, and Verizon have all finished the bulk of their initial 5G network buildouts, and now they’re working on refining their systems with technological upgrades (more on that below) while shifting their resources from legacy 4G LTE operations and into their new 5G networks.
Broadly, Verizon’s capture of the Overall RootScore Award for best overall network performance reflects the operator’s 4G LTE and 5G strength in both urban and rural areas, where it was able to provide relatively consistent and reliable data and call connections to customers at the very edge of its signal footprint. Atop that execution, the operator also showed a noteworthy shift from the non-standalone (NSA) version of 5G to the more advanced standalone (SA) version.
AT&T’s network performance, meanwhile, remained relatively steady amid the operator’s ongoing swap-out of Nokia equipment with gear from networking vendor Ericsson. T-Mobile continued to post extremely impressive speeds in select areas—but the operator has not yet been able to expand those speeds into enough urban and rural locations to win the Fastest 5G Award or the RootMetrics Overall RootScore Award. (It remains to be seen how T-Mobile’s recent acquisition of some of UScellular’s assets might change that situation.)
Regardless, U.S. mobile consumers are the ones who benefit from this ongoing horse race. On a nationwide, aggregated basis-–one that looks at the combined results from all three operators—overall mobile speeds have risen significantly. And so have the chances for a user to get a 5G signal.
Specifically, RootMetrics data shows that the nationwide median wireless speeds in the U.S. (comprising all technologies, including 4G and 5G) rose from 212 Mbps in the second half of 2024 to 276 Mbps in the second half of 2025, according to RootMetrics’ download testing via flagship Android smartphones. Also, during that same time period, the availability of a 5G signal (meaning, the percent of all RootMetrics’ download tests that registered receiving a 5G signal) rose from 82.4% in the second half of 2024 to 89.7% in the second half of 2025.
Now, here’s a look at the spectrum, technologies, and strategies underpinning each operator’s RootMetrics results:
A major element in AT&T’s 5G story involves the midband 3.45 GHz spectrum licenses the operator is using to supplement its existing C-band (3.7 GHz – 3.98 GHz) spectrum holdings. The operator is clearly keen on this band, considering the $23 billion worth of such spectrum AT&T agreed to purchase from EchoStar in August. Midband spectrum, like 3.45 GHz and C-band, generally creates the foundation for speedy 5G networks.
In their tests in the second half of 2025, RootMetrics’ technicians began seeing additional 3.45 GHz holdings popping up in AT&T’s network starting in September, in locations stretching from California to Indiana. Testing showed AT&T generally deploying 5G on 60 MHz chunks in the band, up from 40 MHz chunks previously. A few areas, including in Oklahoma and Maine, showed AT&T services across 100 MHz blocks of spectrum in the 3.45 GHz band. This expansion—touted by AT&T itself in November—will undoubtedly help improve the operator’s overall 5G performance. After all, more spectrum typically results in better, faster networks.
AT&T’s shift from Nokia to Ericsson gear is also clear in RootMetrics data. Ericsson now accounts for more than 80% of AT&T’s radio access network (RAN) in RootMetrics testing samples. Further, AT&T’s switch to Ericsson seems to be bearing fruit: AT&T markets with Ericsson equipment ranked second in RootMetrics performance metrics, trailing only those operated by Verizon and its vendors (Samsung and Ericsson). In terms of RootMetrics’ reliability testing, AT&T is also seeing higher task success rates, and higher median task speeds, in its Ericsson markets when compared with its legacy Nokia markets.
Finally, AT&T tied with Verizon on the RootScore Award for call performance—that’s noteworthy considering the vast majority of AT&T’s calls in RootMetrics testing traveled over its VoLTE service. Voice over LTE (VoLTE) technology sends voice calls over a 4G LTE connection, generally producing clearer audio and faster call connections than legacy voice protocols. In comparison, most of T-Mobile’s calls traveled over the newer VoNR standard (basically, voice calling over 5G), while Verizon used a mix of VoLTE, VoNR, and EPS Fallback, a 5G technology that automatically switches a call to a 4G LTE network if necessary.Overall, less than 1% of the calls traveling over AT&T and Verizon’s networks failed in the U.S. cities covered by RootMetrics’ metro-area testing. In more rural RootMetrics state-area testing (which covered locations in large and small towns, as well as the highways between them), that call failure rate hovered around 3% (or three out of every 100 calls). T-Mobile’s call-failure rates were a few points higher in both metro and state testing, which may reflect the teething pains of implementing the relatively new VoNR standard.
T-Mobile continues to leverage the latest in 5G technologies to juice the speeds of its connections. That strategy is clear in the operator’s ongoing embrace of 5G SA technology as well as its effort to stack together multiple aggregated carriers. (Carrier aggregation technology essentially combines transmissions across multiple spectrum bands into a single data pipe, thus supporting faster speeds and more stable connections.)
In metro areas, fully 93.2% of T-Mobile’s testing samples leveraged 5G SA technology. That’s important considering SA connections generally support snappier connections as well as advanced 5G technologies like network slicing (which can carve out network resources for specific applications). In comparison, AT&T showed no SA samples in RootMetrics testing, while Verizon’s SA samples in the fourth quarter of 2025 totalled 59.7%, with the remainder of its connections spread across 5G NSA and LTE.
T-Mobile also showed a lead in carrier aggregation: Just over two-thirds of T-Mobile’s 5G samples in urban, metro areas used 4-carrier aggregation. That level of aggregation created a connection spanning 216.9 MHz worth of spectrum. That’s a big reason why T-Mobile’s national median download speed reached 374.5 Mbps and was faster than those of both AT&T and Verizon.
In comparison, almost a half of AT&T’s samples in metro areas used 2-carrier aggregation (for a total of 128.9 MHz worth of spectrum), and a majority of Verizon’s connections used 3-carrier aggregation (for 167 MHz).
The correlation between spectrum and speed is also visible in RootMetrics’ calculation of the total average 5G and LTE spectrum deployed by each of the operators in urban, metro areas. For this specific metric, T-Mobile registered 191.3 MHz in the fourth quarter of 2025. That allowed the operator to post median download speeds of 508.2 Mbps (again, this is specific to metro areas). Verizon’s 382.5 Mbps relied on the operator’s 174.1 MHz worth of spectrum. Meanwhile, AT&T’s 383.6 Mbps speeds used just 134.7 MHz of bandwidth, indicating the operator is able to eke out clear efficiencies from its spectrum holdings.
So why didn’t T-Mobile win the Fastest 5G Award? Basically, it’s because Verizon’s performance among its slowest testing samples (the bottom 5%) was better. RootMetrics’ scoring system doesn’t just measure the fastest single connection an operator provides (although it does do that too—Verizon’s peak speeds in urban areas, powered by its millimeter-wave spectrum, reached 5.49 Gbps in the fourth quarter of 2025!). Instead, RootMetrics’ scoring system looks at all of an operator’s testing samples, all over the country, and uses a scoring curve to determine the overall fastest provider across all of those samples.
A headline for Verizon’s 5G efforts in 2025 would center on its shift to SA technology. Verizon expanded its use of 5G SA from 24.5% of samples in the first half of 2025 to fully 59.7% in the second half of 2025, in RootMetrics’ metro testing areas. Verizon’s embrace of 5G SA varies across the country, ranging from 19.4% in Jackson, Mississippi, to 62.3% in Reno, Nevada, to 98.4% in Omaha, Nebraska.
But the share of Verizon’s 5G SA samples were lower in the more rural, state-area locations in RootMetrics’ testing. Specifically, 28.7% of Verizon’s samples in these locations registered 5G SA technology in the second half of 2025, up from 10.2% in the first half. That’s not a surprise, though, considering wireless operators typically deploy advanced technologies first in big cities and then, later, into more rural locations.
Also during 2025, Verizon increased the use of its midband C-band spectrum to 81.3% of all samples in metro areas by the fourth quarter of 2025, up from 74.4% in the first quarter of 2025. And it shifted more of its systems to higher orders of QAM (which packs more data into transmissions) and higher orders of MIMO (which transmits and receives signals across multiple antennas). These efforts generally helped Verizon expand the reach and performance of its 5G network (though it’s not yet clear how Verizon’s new CEO might address this work into 2026).
Interestingly, Verizon also leveraged SRS (Sounding Reference Signal) antenna switching technology to a greater degree than either AT&T or T-Mobile. Close to half of Verizon’s samples in metro areas leveraged this technology. SRS antenna switching allows a user’s phone to quickly cycle its transmitter across all its antennas, helping an operator’s base station “see” which one is best for sending back data. This too can support better connections.
But it was Verizon’s performance in more rural areas—those along RootMetrics’ state-area testing locations—that did the most to raise the operator’s Overall RootScores. There were a number of factors at play here.
First, Verizon made more use of its legacy 4G LTE operations than AT&T and T-Mobile. Almost half of Verizon’s samples along RootMetrics’ state-testing routes connected to its 4G LTE network, above the one-third of AT&T’s samples, and far ahead T-Mobile’s 4G LTE usage, which was in the single digits. This is important because Verizon, like all U.S. operators spent, much of the 2010s deploying and reinforcing its 4G LTE network all over the country. That network is now mature and robust. 5G technology, meanwhile, is just a few years old.
Further, Verizon’s 4G LTE play leveraged its 700 MHz Band 13 and 850 MHz Band 5 spectrum holdings in these more rural areas, a move likely intended to harness the coverage capabilities of this lowband spectrum.
This strategy helped Verizon provide suitable connections even among RootMetrics testing samples with the slowest speeds.
Note: All testing in this report is based on data collected from off-the-shelf smartphones, with measurements pulled from the Android operating system and device modem logs. The standard results and awards sections focus on application-layer measurements, which are designed to reflect real-world user experience, while the Analyst Deep Dive focuses on physical-layer measurements, which are better suited for detailed technical analysis. Because application-layer and physical-layer measurements capture performance differently, metrics in the Analyst Deep Dive may differ from those reported elsewhere in this report.
About the Analyst

Mike Dano
Mike Dano is a Lead Industry Analyst in Ookla’s research and content team. He covers the North and South American markets, and global technology trends. Previously, Mike was a journalist covering the global telecom industry for 25 years at publications including RCR Wireless News, Fierce Network and Light Reading.
The contents of this report are the property of Ookla, LLC and may not be copied, redistributed, published, displayed, performed, modified, exploited or used for commercial purposes, including use in advertisements or other promotional content, without express written permission. This includes, but is not limited to, data, written analysis, images, logos, charts and graphs and other items that may appear on this page. Members of the press, academics, non-profit researchers and others using the findings in this report for non-commercial purposes are welcome to publicly share and link to report information with attribution to Ookla. For more information, please contact press@ookla.com.